BLS 2025 Skilled Trades Wages: Every Major Trade, One Reference
The Bureau of Labor Statistics released its May 2025 Occupational Employment and Wage Statistics (OEWS) report on May 15, 2026 — and the BLS 2025 skilled trades wages data brings the most current pay benchmarks available for every major trade in the US. This post pulls every relevant number from the official report into one place so you can stop digging through 23-page federal tables.
Table of Contents
Quick facts: BLS May 2025 OEWS — Skilled Trades
- Report released: May 15, 2026 (data collected May 2025)
- Construction & extraction employment: 6.4 million workers
- Mean wage across all construction occupations: $65,360/yr
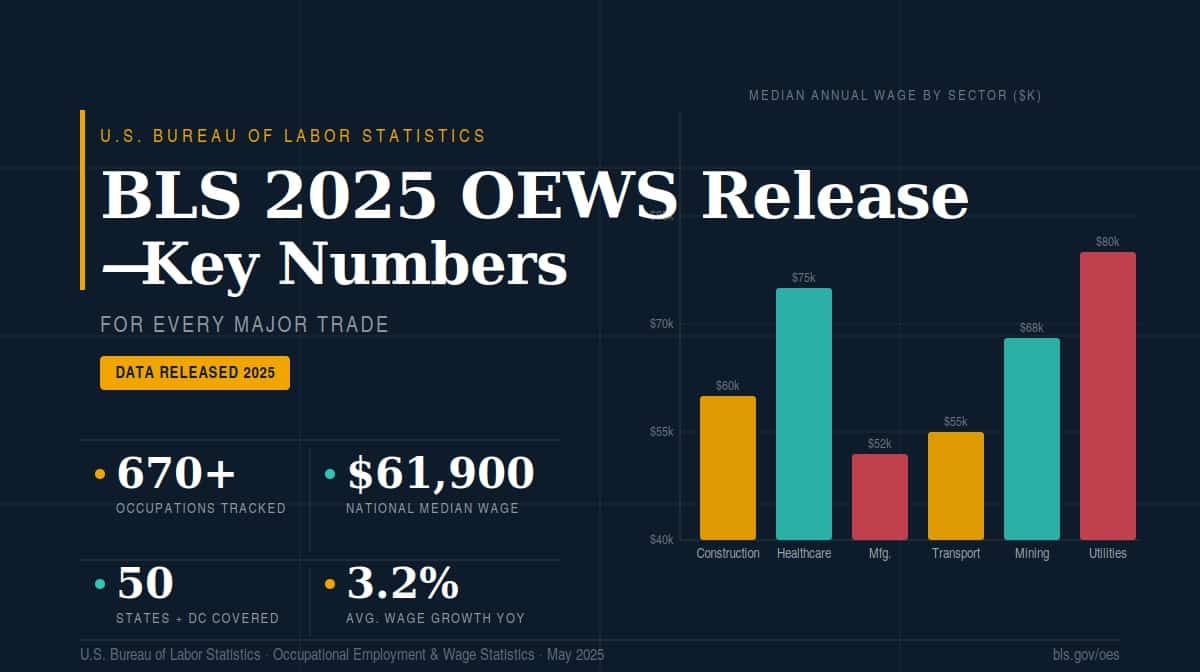
- US average wage (all occupations): $69,770/yr
- Highest-paying trade: Elevator & escalator installers — $109,820/yr mean
- Source: BLS Occupational Employment and Wage Statistics, May 2025
What the BLS 2025 Data Covers
The OEWS survey is an employer-based survey covering roughly 1.1 million establishments across the US. The May 2025 estimates draw on six semiannual data panels collected between November 2022 and May 2025, representing approximately 84.7 million workers — about 55% of total national employment.
A note on the timeline: a federal government shutdown from October 1 through November 12, 2025 delayed collection and processing for the May 2025 panel. The BLS confirmed the response rate remained within the normal range and no methodology changes were required. The data is fully reliable — it just arrived on a later schedule than prior years.
Wages reported here are straight-time gross pay, excluding overtime, shift differentials, and nonproduction bonuses. When you see “mean annual wage,” that figure is calculated by multiplying the mean hourly wage by 2,080 hours. Median wages represent the midpoint of the wage distribution — half of workers earn more, half earn less.
Good to know
These wages cover wage and salary workers only — the survey excludes self-employed tradespeople and business owners. If you run your own contracting business, your actual earnings can be significantly higher (or lower) than the figures shown here.
Master Trades Wage Table — May 2025
All figures are from the BLS OEWS May 2025 release. Mean annual wages are used where median hourly wages are also available; both are shown.
| Trade | Employment | Median Hourly Wage | Mean Annual Wage |
|---|---|---|---|
| Elevator & Escalator Installers/Repairers | 23,790 | $52.80 | $109,820 |
| Electrical Power-Line Installers & Repairers | 131,070 | $44.22 | $91,970 |
| First-Line Supervisors (Construction Trades) | 812,210 | $41.56 | $86,450 |
| Plumbers, Pipefitters & Steamfitters | 465,840 | $34.70 | $72,170 |
| Electricians | 757,220 | $34.37 | $71,490 |
| Millwrights | 40,330 | $33.55 | $69,780 |
| HVAC Mechanics & Installers | 541,070 | $32.75 | $68,120 |
| Industrial Machinery Mechanics | 439,640 | $32.91 | $68,460 |
| Carpenters | 670,090 | $31.55 | $65,630 |
| Sheet Metal Workers | 119,770 | $32.62 | $67,850 |
| Brickmasons & Blockmasons | 52,550 | $32.83 | $68,280 |
| Operating Engineers & Equipment Operators | 478,090 | $31.87 | $66,290 |
| Construction & Building Inspectors | 146,720 | $37.37 | $77,730 |
| Roofers | 135,490 | $27.95 | $58,140 |
| Painters (Construction & Maintenance) | 225,190 | $26.64 | $55,420 |
| Welders, Cutters & Solderers | 416,210 | $27.29 | $56,760 |
| Construction Laborers | 1,096,780 | $25.02 | $52,030 |
Source: BLS Occupational Employment and Wage Statistics, May 2025. Mean annual wages calculated at 2,080 hours/year.
Highest-Paying Trades in 2025
Elevator and escalator installers and repairers remain the single highest-paying construction trade in the country by a wide margin, at a mean annual wage of $109,820 (BLS, May 2025). That’s more than the US average wage for all occupations combined ($69,770) — and more than most bachelor’s degree jobs.
The second-highest trade on this list often surprises people: electrical power-line installers and repairers earn a mean of $91,970 per year. The work is physically demanding and involves significant hazard pay, but the wage reflects it. These are the workers who install and maintain the high-voltage transmission and distribution lines that power the grid.
Construction and building inspectors come in at $77,730 mean annual, a career path worth flagging for current journeymen and master-level tradespeople looking to transition off the tools. Inspectors typically need a trade license plus some combination of experience and certifications — see our complete guide to the skilled trades career path for how the progression typically works.
Pro tip
Mean wages are pulled up by the highest earners in a trade. For a more conservative benchmark of what you’ll likely earn entering the field, look at the median hourly wage — that’s the actual midpoint of the workforce. For electricians, median hourly is $34.37/hr vs. a mean that implies a higher figure when some top earners are included.
Construction Sector Overview
The construction and extraction sector employed 6.4 million workers in May 2025, representing 4.1% of total national employment. The mean wage across all construction and extraction occupations was $65,360 — still below the US-wide average wage of $69,770, but closing the gap as demand for skilled workers continues to push wages upward.
The largest individual occupations in the sector were construction laborers (1.1 million), first-line supervisors (812,210), electricians (757,220), and carpenters (670,090). The concentration of construction workers is highest in Wyoming (9.1% of state employment) and North Dakota (8.1%), reflecting the energy and infrastructure work in those states.
The industries with the highest employment of construction occupations were building equipment contractors (1.3 million) — which includes most electrical, plumbing, and HVAC contractors — followed by foundation and structural contractors (709,410) and building finishing contractors (583,790).
Trade-by-Trade Breakdowns
Electricians
With 757,220 workers, electricians are the third-largest construction occupation in the US. The median hourly wage is $34.37, with a mean annual wage of $71,490 (BLS, May 2025). Helper electricians — those still in the early stages of their apprenticeship — earn a mean of $44,080 per year, which is a reasonable benchmark for what to expect in years one and two of an IBEW or non-union apprenticeship.
Learn how to become an electrician.
Plumbers, Pipefitters & Steamfitters
At a mean annual wage of $72,170 and median hourly of $34.70, plumbers and pipefitters now edge out electricians on both metrics in the May 2025 data. Total employment sits at 465,840. Pipelayers — the entry-level category within this occupational group — earn a mean of $54,700, while the full plumbers/pipefitters/steamfitters category reflects journeyman and above. Helper wages for this group average $43,730.
Learn how to become a plumber.
HVAC Mechanics & Installers
HVAC mechanics and installers — the BLS category that covers residential and commercial heating, cooling, and refrigeration work — employ 541,070 workers at a mean annual wage of $68,120 and median hourly of $32.75 (BLS, May 2025). HVAC sits below electricians and plumbers on raw wage, but consistently shows strong job growth driven by climate-related demand for heat pumps, energy-efficient systems, and commercial refrigeration.
Complete guide: how to become an HVAC technician.
Carpenters
670,090 carpenters employed nationally, mean annual wage $65,630, median hourly $31.55 (BLS, May 2025). Carpenters have the widest income range of any trade — finish carpenters and cabinet makers in high-cost metros can earn well above the mean, while residential framing in lower-cost markets tracks closer to the median.
Welders, Cutters, Solderers & Brazers
The May 2025 data shows 416,210 welders at a mean annual wage of $56,760 and median hourly of $27.29. Of all major trades, welding has the widest variance based on specialization. Underwater welders, pipeline welders, and aerospace welders earn dramatically more than the mean — the BLS figure reflects the full workforce including entry-level shop welders at manufacturers. If you’re targeting the high end of the trade, underwater and pipeline welding are where the wages are.
Millwrights
A smaller but well-compensated trade: 40,330 millwrights nationwide earn a mean annual wage of $69,780 and median hourly of $33.55 (BLS, May 2025). Millwrights install, maintain, and repair industrial machinery — it’s a skilled industrial trade with strong union representation through the United Brotherhood of Carpenters (UBC).
Sheet Metal Workers
Sheet metal workers — covering ductwork fabrication and installation, roofing, and architectural metalwork — earn a mean annual wage of $67,850 at a median hourly of $32.62. Employment is 119,770. Sheet metal work is heavily unionized through SMART (Sheet Metal, Air, Rail and Transportation Workers), and union wages in major metro areas can significantly exceed the national mean.
Construction & Building Inspectors
Worth calling out specifically for career changers and experienced tradespeople: building inspectors earn a mean of $77,730 annually at a median hourly of $37.37 — higher per-hour than electricians and plumbers. Employment is 146,720. This is a realistic next career step for licensed journeymen or masters who want to reduce physical workload while staying in the industry.
Good to know
The BLS OEWS data reports national averages across all employer types, union and non-union, metro and rural. Your actual wages will depend heavily on your state, whether you’re in a union, and whether you work in residential, commercial, or industrial settings. For state-specific figures, BLS publishes state-level OEWS data at bls.gov/oes/current/oessrcst.htm — the May 2025 state data is available there now.
Entry-Level and Helper Wages
The main trades table above shows journeyman-and-above wages for most occupations. Here’s what BLS reports for the helper classifications — which is a useful benchmark for apprenticeship earnings in years one through two:
| Helper Category | Employment | Median Hourly | Mean Annual |
|---|---|---|---|
| Helpers — Electricians | 63,630 | $21.19 | $44,080 |
| Helpers — Pipelayers, Plumbers, Pipefitters & Steamfitters | 44,330 | $21.03 | $43,730 |
| Helpers — Carpenters | 21,680 | $21.18 | $44,050 |
| Helpers — Roofers | 6,030 | $21.71 | $45,150 |
| Helpers — Painters, Paperhangers & Plasterers | 7,490 | $20.40 | $42,440 |
| Helpers — Brickmasons, Blockmasons & Tile Setters | 14,170 | $24.48 | $50,920 |
Source: BLS OEWS, May 2025. Helper wages reflect the early-career, pre-journeyman classifications.
One thing worth noting: in registered apprenticeship programs, your wages are set by your apprenticeship agreement — typically starting around 40–50% of journeyman scale and stepping up each year. The BLS helper figures above are a reasonable cross-check, but your specific starting wage depends on your program and location.
What Changed: The Plumber-Electrician Flip
The headline shift in this year’s data worth paying attention to: plumbers (mean $72,170) now outpace electricians (mean $71,490) on both median hourly and mean annual wages. In prior OEWS releases, those numbers were reversed or nearly identical. Whether this gap holds in future surveys remains to be seen, but it reflects consistent demand pressure in plumbing driven by aging residential infrastructure, water system upgrades, and the skilled worker shortage that’s hit the plumbing trade particularly hard.
The other number worth flagging is HVAC: at $68,120 mean annual, HVAC mechanics now trail electricians and plumbers by roughly $3,000–$4,000 per year. That gap has been narrowing. Given the demand trajectory for HVAC — heat pump installations, commercial HVAC retrofits for energy efficiency — wages in this trade are likely to continue rising.
The overall construction sector mean of $65,360 remains below the US national average of $69,770. But this number is dragged down by laborers, painters, and helpers at the lower end of the pay scale. For licensed journeymen and above, most trades already clear the national average.
Pro tip
If you’re comparing trade wages to see which career pays more, don’t just look at the national mean. Check the state-level BLS data for wherever you plan to work. Electricians in Illinois or California can earn $30,000–$40,000 more per year than electricians in Mississippi or Arkansas — the spread between high- and low-wage states is enormous in every trade.
Frequently Asked Questions
What is the highest-paying skilled trade in 2025?
According to the BLS OEWS May 2025 data, elevator and escalator installers and repairers are the highest-paying construction trade with a mean annual wage of $109,820. Electrical power-line installers and repairers are second at $91,970. Among the broader trades, first-line supervisors of construction trades earn a mean of $86,450.
Do electricians or plumbers earn more in 2025?
In the May 2025 BLS data, plumbers, pipefitters, and steamfitters edge out electricians on both metrics: $34.70/hr median and $72,170 mean annual vs. $34.37/hr median and $71,490 mean annual for electricians. The difference is modest — about $680 per year on mean annual wages — and varies significantly by state and union status.
When was the BLS May 2025 OEWS data released?
The BLS released the May 2025 OEWS data on May 15, 2026. The release was delayed from the typical schedule because of a federal government shutdown that ran from October 1 through November 12, 2025, which pushed back the collection and processing window. The BLS confirmed the data quality was not affected and the response rate was within normal range.
How many electricians are employed in the US?
As of May 2025, the BLS reports 757,220 electricians employed in the US, making them the third-largest construction occupation nationally, behind construction laborers (1.1 million) and first-line supervisors (812,210). An additional 63,630 are classified as helpers—electricians, representing apprentices and pre-journeyman workers.
Do BLS wage figures include overtime pay?
No. BLS OEWS wages are straight-time gross pay and explicitly exclude overtime pay, shift differentials, and nonproduction bonuses. In trades where overtime is common — particularly electrical, plumbing, and industrial work — actual total compensation can be meaningfully higher than the figures reported here.
Where can I find state-level trade wage data from BLS?
BLS publishes state-level OEWS wage data at bls.gov/oes/current/oessrcst.htm. The May 2025 state data is available there now. You can look up any occupation by state and find median and mean wages specific to where you live or plan to work — which will often differ significantly from the national figures shown in this article.