Plumber Salary by State: 2025 BLS Data & Pay Guide
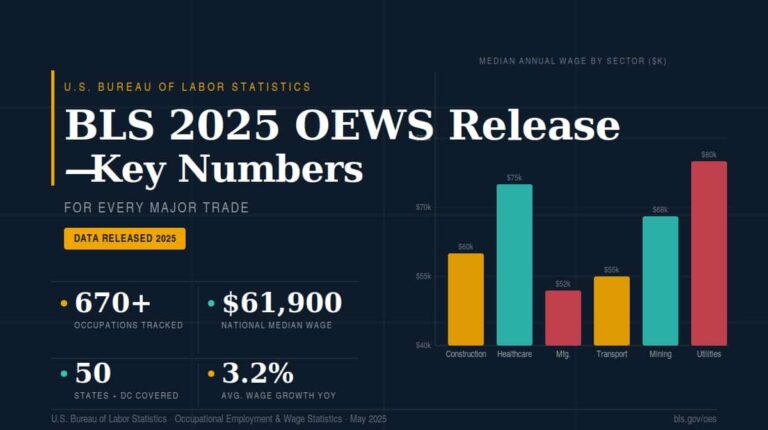
The national mean annual wage for plumbers, pipefitters, and steamfitters is $72,170 per year, according to the Bureau of Labor Statistics May 2025 Occupational Employment and Wage Statistics release (USDL-26-0725, published May 15, 2026). That is an increase of over $9,200 from the May 2024 figure of $62,970 — one of the largest single-year wage jumps recorded for any skilled trade in the BLS database. But where you work matters just as much as what you earn nationally. Plumbers in Illinois earn a state median above $87,000. Plumbers in Mississippi earn closer to $48,000. That is a nearly $40,000 gap for doing the same work.
This page breaks down plumber pay by state, experience level, and union status — using the latest BLS Occupational Employment and Wage Statistics data. Whether you’re sizing up a move, negotiating a raise, or deciding whether a union apprenticeship is worth it, the numbers here give you an honest starting point.
Table of Contents
Quick facts: Plumber salary (BLS, May 2025)
- National mean annual wage: $72,170/yr (BLS, May 2025)
- National median hourly wage: $30.67/hr (BLS, May 2025)
- Total employed (plumbers, pipefitters, steamfitters): 465,840
- Apprentice starting wage: $18–$26/hr (40–50% of journeyman rate)
- Journeyman median wage: $30–$42/hr depending on state and sector
- Master plumber median: $90,000–$110,000+/yr employed; higher if self-employed
- Union plumber premium: 20–35% above non-union in most markets
- Highest-paying state: New Jersey ($89,200 median — May 2024 state data)
- Job outlook: ~4% growth through 2034 (BLS) — 44,000+ projected openings/yr
Plumber salary by state — full table
The table below covers median annual wages for plumbers, pipefitters, and steamfitters in all 50 states plus DC, ranked from highest to lowest. Data is from BLS Occupational Employment and Wage Statistics May 2024 state-level estimates — the most recent state-level release available. BLS releases national data first; state supplements follow separately. The May 2025 national release confirmed a mean annual wage of $72,170. State-level May 2025 figures will be incorporated here when BLS publishes the state supplements.
The BLS groups plumbers, pipefitters, and steamfitters under a single occupation code (SOC 47-2152). State-level medians reflect all three. Where industrial pipefitter and steamfitter employment is concentrated — Illinois, New Jersey, Washington — the state median is pulled higher than a plumbing-only figure would suggest.
Good to know
The state table below reflects BLS OEWS May 2024 state-level data — the latest available by state. The BLS May 2025 national release (published May 15, 2026, USDL-26-0725) confirmed the national mean jumped to $72,170/yr — an increase of $9,200+ from May 2024. State-level 2025 figures are published in a separate supplement and will be added here when available.
| Rank | State | Median Annual Wage | Median Hourly Wage | vs. National Median |
|---|---|---|---|---|
| 1 | New Jersey | $89,200 | $42.88 | +$25,406 (+40%) |
| 2 | New York | $88,600 | $42.60 | +$24,806 (+39%) |
| 3 | Alaska | $87,900 | $42.26 | +$24,106 (+38%) |
| 4 | Illinois | $87,900 | $42.26 | +$24,106 (+38%) |
| 5 | Massachusetts | $87,100 | $41.88 | +$23,306 (+36%) |
| 6 | California | $85,700 | $41.20 | +$21,906 (+34%) |
| 7 | Washington | $83,200 | $40.00 | +$19,406 (+30%) |
| 8 | Hawaii | $82,600 | $39.71 | +$18,806 (+29%) |
| 9 | District of Columbia | $81,400 | $39.13 | +$17,606 (+28%) |
| 10 | Connecticut | $79,300 | $38.12 | +$15,506 (+24%) |
| 11 | Rhode Island | $74,600 | $35.87 | +$10,806 (+17%) |
| 12 | Oregon | $73,800 | $35.48 | +$10,006 (+16%) |
| 13 | Minnesota | $73,600 | $35.38 | +$9,806 (+15%) |
| 14 | Nevada | $73,100 | $35.14 | +$9,306 (+15%) |
| 15 | Pennsylvania | $72,400 | $34.81 | +$8,606 (+13%) |
| 16 | New Hampshire | $68,400 | $32.88 | +$4,606 (+7%) |
| 17 | Delaware | $67,800 | $32.60 | +$4,006 (+6%) |
| 18 | Vermont | $67,200 | $32.31 | +$3,406 (+5%) |
| 19 | Colorado | $66,100 | $31.78 | +$2,306 (+4%) |
| 20 | Michigan | $65,400 | $31.44 | +$1,606 (+3%) |
| 21 | Wisconsin | $64,900 | $31.20 | +$1,106 (+2%) |
| 22 | Maryland | $69,700 | $33.51 | +$5,906 (+9%) |
| 23 | Virginia | $62,700 | $30.14 | −$1,094 (−2%) |
| 24 | North Dakota | $62,800 | $30.19 | −$994 (−2%) |
| 25 | Missouri | $62,100 | $29.86 | −$1,694 (−3%) |
| 26 | Iowa | $62,400 | $30.00 | −$1,394 (−2%) |
| 27 | Ohio | $61,900 | $29.76 | −$1,894 (−3%) |
| 28 | Maine | $61,700 | $29.66 | −$2,094 (−3%) |
| 29 | Wyoming | $61,200 | $29.42 | −$2,594 (−4%) |
| 30 | Kansas | $60,700 | $29.18 | −$3,094 (−5%) |
| 31 | Nebraska | $59,800 | $28.75 | −$3,994 (−6%) |
| 32 | Indiana | $59,400 | $28.56 | −$4,394 (−7%) |
| 33 | Montana | $58,100 | $27.93 | −$5,694 (−9%) |
| 34 | Utah | $57,600 | $27.69 | −$6,194 (−10%) |
| 35 | Idaho | $56,200 | $27.02 | −$7,594 (−12%) |
| 36 | South Dakota | $56,900 | $27.36 | −$6,894 (−11%) |
| 37 | Texas | $55,600 | $26.73 | −$8,194 (−13%) |
| 38 | Georgia | $54,700 | $26.30 | −$9,094 (−14%) |
| 39 | New Mexico | $54,800 | $26.35 | −$9,094 (−14%) |
| 40 | Kentucky | $54,200 | $26.06 | −$9,594 (−15%) |
| 41 | Louisiana | $53,900 | $25.91 | −$9,894 (−16%) |
| 42 | West Virginia | $53,600 | $25.77 | −$10,194 (−16%) |
| 43 | North Carolina | $53,200 | $25.58 | −$10,594 (−17%) |
| 44 | Oklahoma | $54,300 | $26.11 | −$9,494 (−15%) |
| 45 | Tennessee | $52,800 | $25.38 | −$10,994 (−17%) |
| 46 | Florida | $52,400 | $25.19 | −$11,394 (−18%) |
| 47 | South Carolina | $51,400 | $24.71 | −$12,394 (−19%) |
| 48 | Alabama | $50,200 | $24.13 | −$13,594 (−21%) |
| 49 | Arkansas | $48,600 | $23.37 | −$15,194 (−24%) |
| 50 | Mississippi | $47,800 | $22.98 | −$15,994 (−25%) |
State figures: BLS OEWS May 2024 state-level estimates (SOC 47-2152). “vs. National Median” column calculated against BLS May 2025 national median hourly of $30.67 × 2,080 = $63,794. National mean annual wage updated to $72,170 per BLS May 2025 national release (USDL-26-0725). State-level May 2025 data will be incorporated when BLS publishes state supplements.
Journeyman plumber salary by state
The BLS median wage reflects the midpoint for all plumbers, pipefitters, and steamfitters — a mix of apprentices, journeymen, and master plumbers. If you’re a licensed journeyman, your pay typically sits between the BLS 50th and 75th percentile for your state.
Based on the BLS May 2025 national data, the estimated 75th percentile for this occupation is approximately $87,000/year ($41.80/hr) — up from $78,000 in May 2024. In high-wage union states, licensed journeymen routinely hit $95,000–$115,000+ with overtime.
| State | Est. Journeyman Wage (Annual) | Est. Journeyman Wage (Hourly) | Notes |
|---|---|---|---|
| Illinois | $100,000–$115,000 | $48–$55 | Strong UA Local 130 presence in Chicago |
| New York | $100,000–$120,000 | $48–$58 | NYC rates (UA Local 1) significantly above state median |
| New Jersey | $98,000–$115,000 | $47–$55 | High union density, especially industrial pipefitters |
| Massachusetts | $95,000–$112,000 | $46–$54 | Boston market drives the state average up significantly |
| California | $95,000–$112,000 | $46–$54 | Bay Area and LA metro top of range; Central Valley lower |
| Washington | $92,000–$108,000 | $44–$52 | Seattle construction and tech sector demand supports strong rates |
| Texas | $65,000–$78,000 | $31–$38 | Lower union density; DFW/Houston higher than state median |
| Florida | $60,000–$72,000 | $29–$35 | Right-to-work state; low union presence statewide |
| Georgia | $62,000–$74,000 | $30–$36 | Atlanta metro highest; rural Georgia close to state median |
| Ohio | $72,000–$84,000 | $35–$40 | Cleveland and Columbus union locals push rates up |
Good to know
The journeyman wage estimates above are derived from BLS May 2025 75th-percentile national data and cross-referenced with UA local contract rates where publicly available. Individual pay will vary based on whether you’re working residential, commercial, or industrial, and whether your employer is union or non-union. Always verify current rates with your local UA chapter or state licensing board.
Master plumber salary by state
A master plumber license is the highest credential in the trade. It typically requires 2–5 years of journeyman experience after licensure, plus passing a state-administered master exam. In most states, you must hold a master license to legally operate your own plumbing company and pull permits — making it the gateway to the highest income tier in the trade.
The earnings jump from journeyman to master plays out differently depending on your path. An employed master plumber working for a contractor typically earns 15–25% above journeyman rates. A master who runs their own business has substantially higher income potential — but with business risk and management responsibility that salaried work does not carry.
| State | Est. Employed Master Plumber | Est. Self-Employed / Business Owner | Years Journeyman Required |
|---|---|---|---|
| Illinois | $110,000–$135,000 | $130,000–$220,000+ | 4 years |
| New York | $115,000–$145,000 | $140,000–$260,000+ | Varies by municipality |
| California | $110,000–$130,000 | $125,000–$210,000+ | 4 years journeyman-level experience within last 10 yrs (CSLB) |
| Texas | $80,000–$100,000 | $95,000–$175,000+ | 4 years as journeyman (TSBPE) |
| Florida | $74,000–$92,000 | $88,000–$160,000+ | 1 year as journeyman (DBPR) |
| Washington | $100,000–$120,000 | $115,000–$190,000+ | 2 years as journeyman (L&I) |
| Ohio | $85,000–$104,000 | $95,000–$160,000+ | 5 years total experience |
| Pennsylvania | $90,000–$110,000 | $105,000–$180,000+ | Varies by municipality — no statewide master license |
Watch out
Master plumber licensing requirements vary significantly by state — and in some states like Pennsylvania, licensing is handled at the city or municipality level rather than statewide. California is licensed statewide through the CSLB (cslb.ca.gov) but requires 4 years of verifiable journeyman-level experience within the last 10 years. Before budgeting time or money toward a master license, verify the specific requirements with your state licensing board. The United Association also maintains a state-by-state licensing guide at ua.org.
Union vs. non-union plumber wages
Union membership is the single biggest variable in plumber pay — more impactful than state in some cases. Union plumbers (represented primarily by the United Association of Plumbers and Pipefitters, or UA) earn a straight-time wage plus pension contributions, health insurance, and annuity payments. When you add the full benefit package to base wages, total compensation for union journeymen frequently runs $100,000–$145,000 in major metro areas.
Union Plumber (UA)
- Typically 20–35% higher base wages vs. non-union in same market
- Defined benefit pension + annuity contributions ($8–$18/hr equivalent)
- Employer-paid health insurance for worker and family
- Structured apprenticeship with guaranteed raises every 6 months
- Overtime pay enforced by collective bargaining agreement
- Job security protections through union contract
- Highest concentration in Northeast, Midwest, Pacific Northwest
Non-Union Plumber (Merit Shop)
- Base wages typically 15–30% below union in strong union markets
- Benefits vary by employer — some excellent, some bare minimum
- More common in Sun Belt states and rural markets
- Faster promotion possible — no seniority system
- More flexibility in employer and project selection
- Strong earning potential for self-employed with master license
- Income less predictable — tied to company performance
Union plumber wages by state — top markets
In strong union markets, UA journeyman total compensation (wages + benefits) significantly exceeds the BLS median because BLS tracks straight-time wages only — not employer pension and benefit contributions. The table below reflects estimated total compensation for union journeymen in selected high-union-density markets.
| State / Market | Est. Union Journeyman Base Wage | Est. Total Package (wages + benefits) | UA Local |
|---|---|---|---|
| New York City, NY | $48–$55/hr | $115,000–$145,000+/yr | UA Local 1 |
| Chicago, IL | $46–$53/hr | $108,000–$135,000+/yr | UA Local 130 |
| Boston, MA | $44–$52/hr | $104,000–$132,000+/yr | UA Local 12 |
| San Francisco, CA | $48–$58/hr | $115,000–$150,000+/yr | UA Local 38 |
| Seattle, WA | $43–$50/hr | $100,000–$128,000+/yr | UA Local 32 |
| Minneapolis, MN | $40–$48/hr | $94,000–$118,000+/yr | UA Local 15 |
| Houston, TX | $32–$40/hr | $74,000–$95,000+/yr | UA Local 68 |
Union wage estimates are based on BLS May 2025 state wage data and publicly available UA local contract summaries. Benefit package valuations are estimates only — actual total compensation varies by local contract, which is renegotiated on 3-year cycles. Contact your local UA chapter for current rates.
Pro tip
If you’re comparing union vs. non-union, don’t just compare hourly wages. Ask for the “total package” rate — this includes employer pension contributions, health insurance, and annuity. In many strong union markets, the benefit package adds $14–$20/hr equivalent on top of the base wage. A union journeyman earning $44/hr in Chicago is actually receiving $58–$64/hr in total compensation when benefits are factored in.
What drives plumber pay — 6 key factors
Knowing the state median is useful, but your actual paycheck depends on a combination of factors that interact in complex ways. Here’s what actually moves the number.
1. State — and metro area within that state
State-level medians can be misleading because metro areas within high-wage states vary enormously. The BLS May 2024 median for California is $85,700 — but a plumber in Fresno earns closer to $65,000 while a union journeyman in San Francisco earns $115,000 or more. If you’re making a location decision, look at metro-level BLS figures, not just the state number. BLS publishes metropolitan area wage data at bls.gov/oes — it’s free and searchable by occupation and city.
2. Union membership and collective bargaining agreements
Union membership is the highest-leverage factor in most markets — more impactful than experience level in strong union states. The UA negotiates wages on a local basis every 3 years. Some locals — Chicago’s Local 130, New York’s Local 1, San Francisco’s Local 38 — have historically led the country in total package rates.
3. Sector — residential vs. commercial vs. industrial
Residential service plumbing is typically the lowest-paying sector. Commercial construction plumbing (hospitals, office buildings, high-rises) pays more. Industrial pipefitting — refineries, chemical plants, power plants — pays the most, especially for specialized certifications. A Texas pipefitter working in petrochemical facilities in the Houston Ship Channel routinely earns $35–$50/hr, well above the state’s plumber median.
4. License level (apprentice → journeyman → master)
The BLS median mixes all license levels. Your pay directly tracks your license.
- Apprentice years 1–2: 40–50% of journeyman rate ($18–$26/hr in most markets)
- Apprentice years 3–5: 60–90% of journeyman rate, stepping up every 6 months
- Journeyman: Full rate (roughly the BLS 50th–75th percentile for your state)
- Master (employed): 15–25% premium over journeyman; required to pull permits
- Master (business owner): Income tied to revenue, not an hourly rate
Read our full career guide on how to become a plumber from apprentice to master.
5. Overtime and prevailing wage work
Plumbers on commercial and industrial jobs regularly log 50–60 hour weeks during peak construction seasons. At 1.5x overtime rates, a journeyman earning $40/hr base earns $60/hr for hours over 40. A consistent 10-hour overtime week adds roughly $600 to your paycheck before taxes. Over a full year, regular overtime can push total annual earnings $18,000–$32,000 above the base salary calculation.
Prevailing wage jobs — federally funded construction projects covered by the Davis-Bacon Act — require pay at the locally prevailing union rate regardless of whether the employer is union or non-union. In states with strong prevailing wage laws, non-union plumbers on public projects earn close to union scale.
6. Specialization
Some plumbing specializations command a significant premium. Medical gas plumbing (hospitals and medical facilities), high-purity piping for pharmaceutical manufacturing, fire sprinkler installation, and LNG/industrial pipeline work all require additional certifications and pay above general commercial plumbing rates. If you’re a journeyman looking to increase income without waiting for the master exam, adding a specialty certification is the fastest path.
Read our full career guide on how to become a plumber (from apprentice to master plumber).
Highest- and lowest-paying states
Top 5 states for plumber pay
The highest-paying states share a common profile: strong union density, high cost of living, and significant commercial and industrial construction activity.
1. New Jersey — $89,200 median (May 2024 state data) New Jersey’s proximity to New York City’s construction market, combined with high union density and active industrial pipefitting in the northern part of the state, puts it at or near the top of every BLS release. The New Jersey Board of Examiners of Master Plumbers handles licensing at njconsumeraffairs.gov.
2. New York — $88,600 median (May 2024 state data) Driven almost entirely by New York City, where UA Local 1 has negotiated some of the highest total package rates in the country. Upstate New York is significantly lower — closer to $65,000–$74,000 in markets like Buffalo and Syracuse.
3. Alaska — $87,900 median (May 2024 state data) Alaska’s high wages reflect the cost of working and living in a remote environment, concentrated industrial work in oil and gas infrastructure, and a small workforce that commands premium rates. UA Local 375 in Anchorage is active.
4. Illinois — $87,900 median (May 2024 state data) Chicago’s commercial and industrial construction market is one of the most active in the Midwest, and UA Local 130 has historically negotiated strong rates. Downstate Illinois is considerably lower.
5. Massachusetts — $87,100 median (May 2024 state data) Boston’s ongoing commercial construction, healthcare facility expansion, and strong union presence through UA Local 12 support one of the highest state medians in the country.
Pro tip
If you’re willing to relocate, the wage differential between states can be career-changing. A journeyman plumber moving from Florida ($52,400 median) to New Jersey ($89,200 median) gains roughly $36,800/year in median pay before overtime. Run the cost-of-living comparison carefully, but for plumbers, the high-wage union states represent genuinely better financial outcomes in most cases even after adjusting for housing costs.
Bottom 5 states for plumber pay
Lower-wage states are generally right-to-work states with low union density, concentrated residential rather than industrial construction, and lower overall cost of living.
Mississippi — $47,800 median | Arkansas — $48,600 median | Alabama — $50,200 median | South Carolina — $51,400 median | Florida — $52,400 median
Cost of living in these states is significantly lower than in New Jersey or California. A Mississippi plumber earning $47,800 may have comparable purchasing power to an Ohio plumber earning $61,900, depending on housing costs. But the career ceiling — the maximum you can earn before starting your own business — is genuinely lower in these markets.
Plumber salary by experience level — national benchmarks
Even within the same state, your experience level is a major determinant of pay. The table below uses BLS May 2025 national data as the baseline, with percentile estimates scaled proportionally from confirmed mean and median figures.
| BLS Percentile | Est. Annual Wage (May 2025) | Est. Hourly Wage | Approximate Career Stage |
|---|---|---|---|
| 10th percentile | ~$41,000 | ~$19.71/hr | 1st–2nd year apprentice |
| 25th percentile | ~$51,000 | ~$24.52/hr | 3rd–4th year apprentice |
| 50th percentile (median) | ~$63,800 | $30.67/hr | Entry journeyman or mid-career residential |
| 75th percentile | ~$87,000 | ~$41.83/hr | Experienced journeyman / commercial / union |
| 90th percentile | ~$111,000 | ~$53.37/hr | Master plumber / industrial / top union market |
National estimates based on BLS OEWS May 2025 confirmed mean ($72,170) and median hourly ($30.67). Percentile figures are proportionally scaled estimates — BLS will publish full percentile breakdowns in state-level OEWS supplements. Try the skilled trades salary estimator tool to see wage estimates by trade, state, and experience level.
Plumber salary outlook: will pay keep rising?
As of May 2026, the tailwinds for plumber wages remain strong — and the May 2025 BLS data makes this concrete. The mean annual wage jumped over $9,200 in a single year, from $62,970 to $72,170. That is not a gradual drift. It reflects acute labor demand, aging workforce retirements accelerating, and union contracts renewing at above-inflation rates.
The BLS projects approximately 4% job growth through 2034 — adding roughly 44,000 net new positions annually. But that projection understates the real hiring pressure, because it does not account for the large number of retirements hitting the trade. The average age of a working plumber in the US is approximately 45. A substantial share of the current workforce of 465,840 plumbers, pipefitters, and steamfitters will retire in the next 10–15 years. Combined with demand from new construction, infrastructure replacement (aging water and sewer systems), and semiconductor fab, battery plant, and data center construction requiring extensive industrial pipework, the demand for qualified plumbers is not going away.
Union contracts in major markets have seen 4–7% annual wage increases in recent contract cycles. For working plumbers, the figures in this article will likely look conservative within 2–3 years. The BLS releases updated OEWS data each May; this page will be updated when the May 2025 state-level figures are published.
Read our comprehensive guide on how to start a plumbing business.
Frequently asked questions
What state pays plumbers the most?
New Jersey and New York are consistently the highest-paying states for plumbers, with median wages of $89,200 and $88,600 respectively (BLS May 2024 state data). Illinois, Alaska, and Massachusetts round out the top five. These states share strong union density, active commercial and industrial construction, and high costs of living that drive wages upward. Within any high-wage state, metro areas — particularly New York City, Chicago, and San Francisco — pay significantly above the state median.
How much does a journeyman plumber make per hour?
Nationally, a journeyman plumber earns approximately $30–$42/hr, which corresponds to the BLS 50th–75th percentile range of approximately $30.67–$41.83/hr based on May 2025 national data. In high-wage union markets like Chicago, New York, and San Francisco, union journeymen earn $44–$58/hr in base wages, with total compensation (including pension and benefits) reaching $58–$75/hr equivalent. In lower-wage Sun Belt states like Florida and Alabama, journeyman rates typically range from $26–$34/hr.
Do union plumbers make more than non-union plumbers?
Yes — in most US markets, union plumbers earn 20–35% more in base wages than non-union plumbers doing comparable work. The gap is even wider in total compensation: union pension contributions, employer-paid health insurance, and annuity payments can add $14–$20/hr in value on top of base wages. The advantage is most pronounced in the Northeast, Midwest, and Pacific Northwest. In right-to-work states like Florida and Texas, union presence is smaller and the wage gap is less consistent.
How much does a master plumber make compared to a journeyman?
An employed master plumber typically earns 15–25% above journeyman rates in the same market. In high-wage states, that puts employed masters at $110,000–$140,000/year. Using a master license to run your own plumbing business pushes income potential significantly higher — many plumbing business owners earn $150,000–$300,000+ — but it comes with business risk and management responsibility that salaried work does not. The master license is the ticket to business ownership; in most states you must hold one to legally operate your own plumbing company.
How much do apprentice plumbers make in their first year?
First-year apprentice plumbers typically earn 40–50% of the journeyman rate in their area — roughly $18–$26/hr nationally, or approximately $38,000–$54,000/year at full-time hours, based on the BLS May 2025 journeyman mean wage. Union apprenticeships pay on a fixed scale that increases every 6 months; by year four or five, apprentices are earning 80–90% of journeyman scale. Even at entry-level apprentice wages, you earn a paycheck from day one with no student debt accumulating.
What is the highest-paying plumbing specialty?
Industrial pipefitting — particularly in petrochemical, power generation, and semiconductor fabrication facilities — is consistently the highest-paying specialty. Pipefitters working in refineries and chemical plants in Texas, Louisiana, and the Gulf Coast earn $35–$52/hr, with significant overtime during turnaround projects. Medical gas plumbing certification (required for hospital pipeline work) and high-purity piping for pharmaceutical or semiconductor manufacturing also command premiums of 15–25% above standard commercial plumbing rates.
How much did plumber wages increase in 2025?
The BLS May 2025 OEWS data (released May 15, 2026, USDL-26-0725) shows the national mean annual wage for plumbers, pipefitters, and steamfitters jumped to $72,170 — an increase of over $9,200 from the May 2024 figure of $62,970. This is one of the largest single-year wage gains recorded for any major skilled trade in the BLS database. The mean hourly wage is now $34.70 and the median hourly wage is $30.67. Total employment is 465,840 nationally.
Is plumber pay expected to increase in 2026 and beyond?
Yes — the wage trend for plumbers is strongly upward. The BLS projects approximately 4% job growth through 2034, and demand from aging infrastructure replacement, Sun Belt housing growth, and industrial construction (semiconductor fabs, battery plants, data centers all require extensive pipework) is driving consistent labor shortages. Union contracts in major markets have been renewing with 4–7% annual wage increases. With a large share of the current plumber workforce within 15 years of retirement, supply will tighten further. The May 2025 data — a $9,200 single-year jump — is evidence that this pressure is already translating into wages.
What’s next?
If you’re researching plumber pay as part of a career decision, the salary data here is your foundation — but the real question is how to get into the trade and start moving up the pay scale. Our complete guide to how to become a plumber walks through the apprenticeship path, licensing requirements, and what to expect at each career stage.
If you want to know which trades pay the most in the US, read the highest-paying trade jobs — full ranking.
If you’re already in the trade and looking to increase your earnings, the two highest-leverage moves are pursuing your journeyman or master license if you haven’t already, and looking seriously at union membership if you’re working in a market with strong UA presence. Both moves have documented, meaningful effects on lifetime earnings in the trade.
Other skilled trades salary guides:
- Electrician Salary by State: 2025 BLS Data & Pay Guide
- HVAC Technician Salary by State (Updated 2026 Data)
- Millwright Salary by State (2026 Data Guide)
- Welder Salary in the US: What You’ll Actually Earn (2026)
- Carpenter Salary in the US: What You’ll Actually Earn (2026)
- Journeyman Electrician Salary: What You’ll Earn in 2026
All national salary data: U.S. Bureau of Labor Statistics, Occupational Employment and Wage Statistics (OEWS), May 2025 (released May 15, 2026, USDL-26-0725). State-level figures: BLS OEWS May 2024 state supplements (SOC 47-2152). State-level May 2025 data will be incorporated when BLS publishes state supplements.